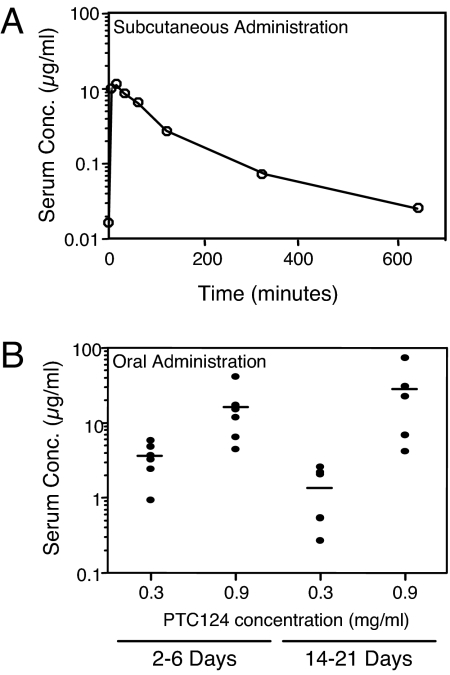
Fig. 3.
Comparison of serum levels of PTC124 after s.c. vs. oral administration. (A) Blood was taken from different age-matched Cftr+/− hCFTR-G542X mice at the indicated times after s.c. injection of 60 mg/kg PTC124. (B) Blood samples were taken after feeding Cftr+/− hCFTR-G542X mice a liquid diet containing 0.3 or 0.9 mg/ml PTC124 for 2–6 days or Cftr−/− hCFTR-G542X mice a liquid diet containing 0.3 or 0.9 mg/ml PTC124 for 14–21 days. The concentration of PTC124 in each serum sample was determined by liquid chromatography/tandem mass spectrometry (for details, see Materials and Methods).

