Fig. 3.
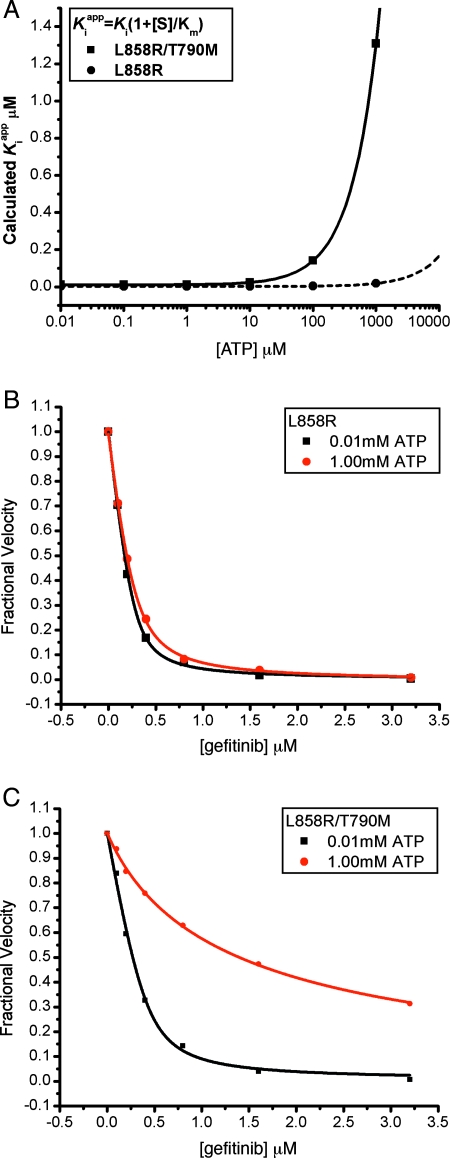
The drug resistance of T790M secondary mutation is manifested only at cellular concentrations of ATP. (A) The calculated Kiapp for the L858R single mutant and L858R/T790M double mutant are plotted versus ATP concentration, using experimentally measured values for the Km[ATP] (Table 2) and setting Ki = Kd as measured (Table 1). Note the expected loss of potency of the double mutant (solid line) as ATP concentrations approach cellular levels (≈1 mM). (B) Inhibition of L858R mutant EGFR kinase by gefitinib in the presence of 10 μM (black squares) or 1.0 mM ATP (red circles). (C) Inhibition of the L858R/T790M double mutant EGFR by gefitinib in the presence of 10 μM (black squares) or 1.0 mM ATP (red circles). In B and C, the in vitro kinase activity of the indicated EGFR mutant was measured in the presence of the indicated concentrations of gefitinib by using an EGFR Tyr-1173 autophosphorylation site peptide (ENAEYLRVA) as substrate.

