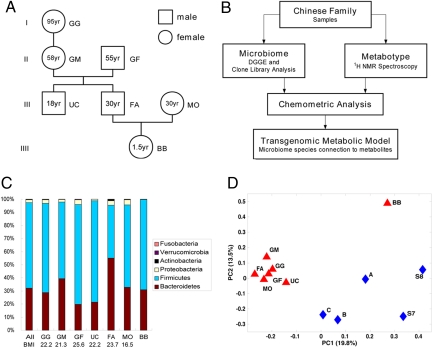
Fig. 1.
Experimental procedure and structural comparison of gut microbiome between Chinese and American individuals. (A) Family tree diagram of the Chinese family. (B) Scheme of experimental procedure. (C) The division-level composition of gut microbiome of the Chinese family. (D) Species-level composition of gut microbiome of the Chinese family in comparison with reported American microbiome data (4, 5). The principal coordinate scores plot was generated by using UniFrac metrics. The percentages of variation described by the principal coordinates are shown in the parentheses.

