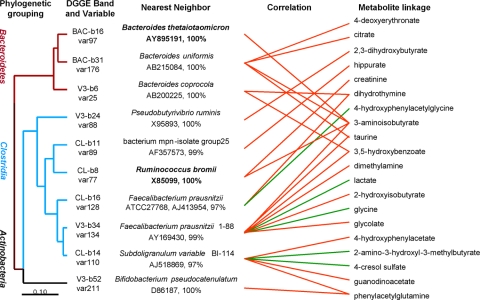
Fig. 3.
Dendrogram of OTUs from DGGE bands, which are well predicted by metabolic variation, labeled as the nearest known neighbor with similarity value. Associations with specific urine metabolites are shown for each OTU with the direction of correlation indicated by red (positive) or green (negative) lines. Gender-related bands predicted by OPLS-DA are denoted by bold text.

