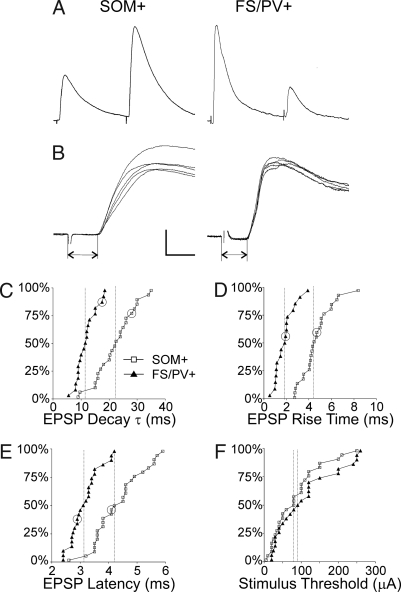
Fig. 3.
Properties of thalamocortical EPSPs in SOM+ and FS/PV+ interneurons. (A) Representative averaged trace of the first two EPSPs from a 10-Hz train. (B) Five superimposed traces from the same cells at a faster time base. Dual arrows indicate synaptic latencies. (Calibration bar: A, 4 mV, 40 ms; B, 5 mV, 4 ms.) (C–F) Cumulative probability histograms comparing EPSP decay τ, rise times, latencies, and thresholds in the two groups of interneurons. Vertical dashed lines indicate the medians in each population. Data points corresponding to the examples in A and B are circled in C–E.

