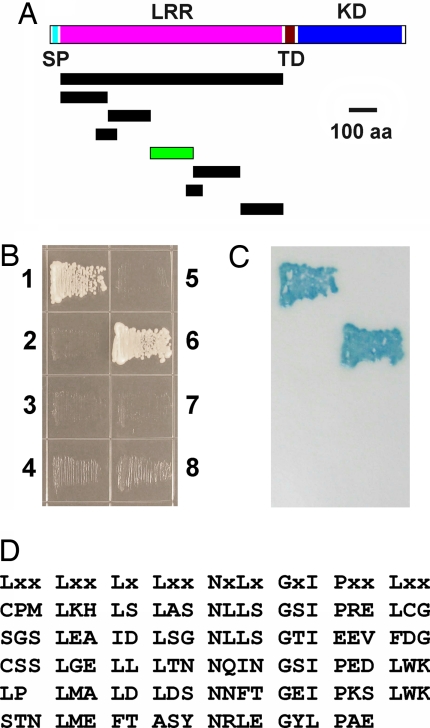
Fig. 2.
TPD1 interacts with EMS1 in yeast two-hybrid assays. (A) Diagram shows constructs for mapping the TPD1 interacting region (TIR) of EMS1. Bar with green color represents the TIR. (B) Yeast grown on synthetic complete (SC) medium without Leu, Trp, and His. (1) Positive control. (2) Negative control. (3) The entire EMS1 LRR domain and TPD1. (4) The entire EMS1 LRR domain. (5) TPD1 alone. (6) TIR and TPD1. (7) TIR alone. (8) Non-TIR and TPD1. (C) Verification of the interaction by filter lift assay showing blue color of yeast. (D) The amino acid sequence of TIR. The consensus LRR sequence is shown at the top.

