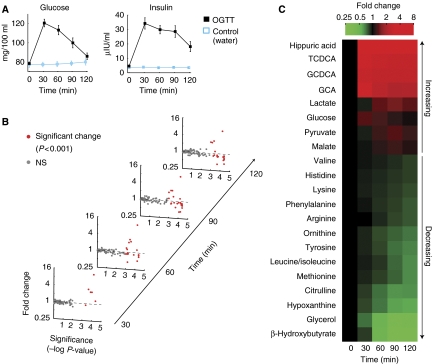
Figure 1.
Temporal response to an oral glucose challenge in individuals with normal glucose tolerance (MACS). (A) Kinetics of blood glucose and insulin in response to glucose ingestion (mean±s.e.m.). (B) Magnitude and significance of metabolite change over time. Dots represent the 97 metabolites detected in plasma. Change is with respect to the fasting metabolite levels. Significant (P<0.001) changes are colored red. (C) Significant metabolite changes. In total, 21 metabolites changed significantly (P<0.001) when compared to their fasting levels and showed a significantly (P<0.05) distinct response compared to control (water ingestion). Color intensity reflects the median fold change compared to the fasting levels. Metabolites are ordered according to the magnitude of change.

