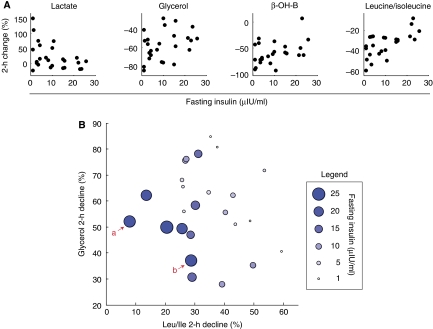
Figure 5.
Correlation between fasting insulin and 2-h metabolite changes in individuals with impaired glucose tolerance (FOS-IGT). (A) 2-h changes in markers of insulin action are correlated with fasting insulin concentration. Each dot corresponds to an individual. (B) A bivariate model explaining fasting insulin using the 2-h decline of Leu/Ile and glycerol. Each circle represents an individual, and the circle size is proportionate to fasting insulin levels. aA representative individual exhibiting a blunted decline in Leu/Ile (resistant to proteolysis suppression). bA representative individual exhibiting a blunted decline in glycerol (resistant to lipolysis suppression).

