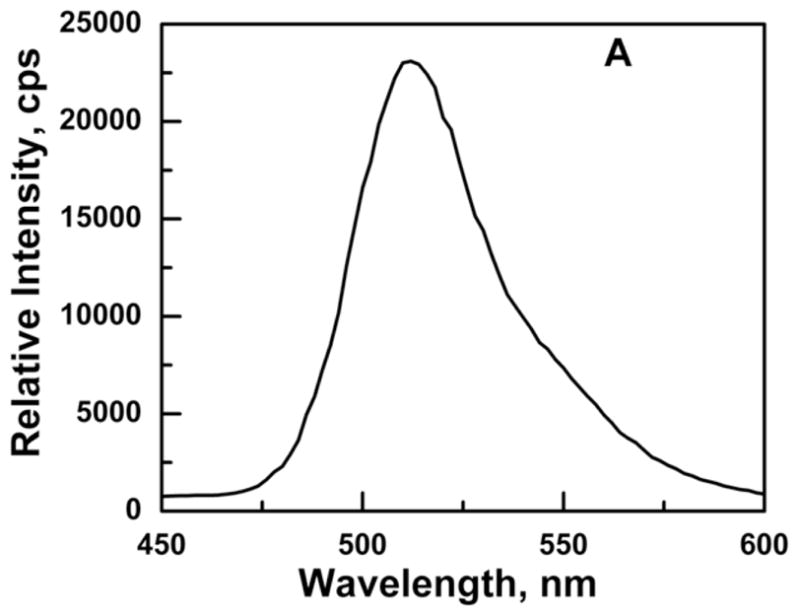
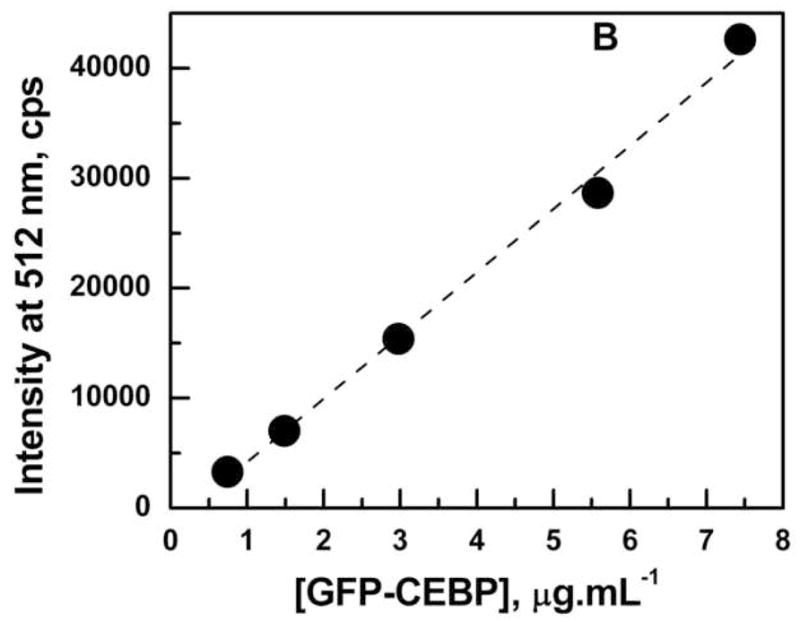
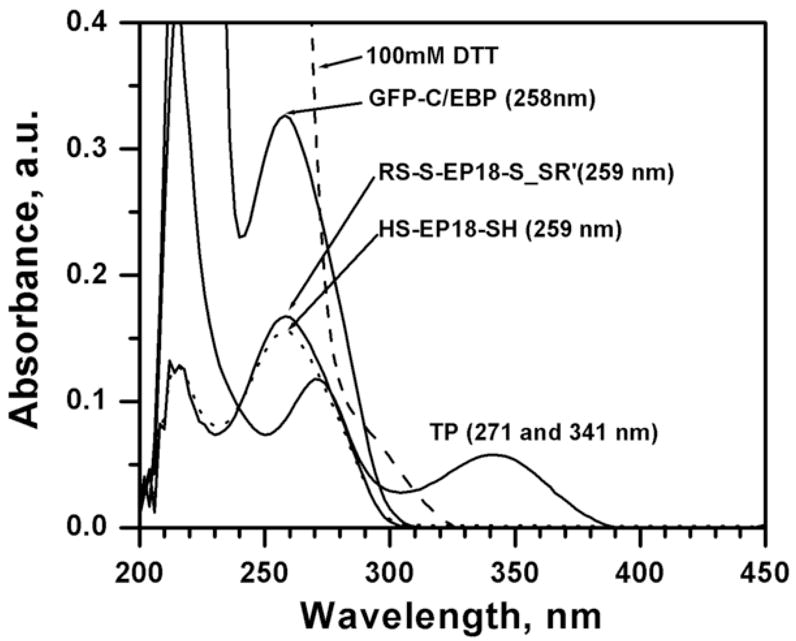
Figure 3.


Panel A: Emission spectrum of Ni2+-NTA purified GFP-C/EBP in TE 0.4, pH = 7.5, T = 25 °C. Excitation was at 398 nm. The protein concentration was 1 μM in 200 μL volume of buffer. Panel B: Generation of a standard curve GFP-C/EBP in TE 0.4, pH = 7.5, T = 25 °C. Excitation was at 398 nm and emission was monitored at 512 nm. The protein concentrations are in the range 0.7 to 7.5 μg.ml−1. The dashed line is the fit to the equation for a straight line. Panel C: UV-Visible scans of GFP-C/EBP (0.5 μM, solid line), 0.5 μM RS-S-EP36-S-SR′ (solid line) and HS-S-EP36-S-SH (dotted line), TP (5 μM, solid line), and 100 mM DTT (dashed line) in TE0.4, pH=7.5 buffer at 25 °C. The λmax values observed are in the parentheses for the individual scans.
