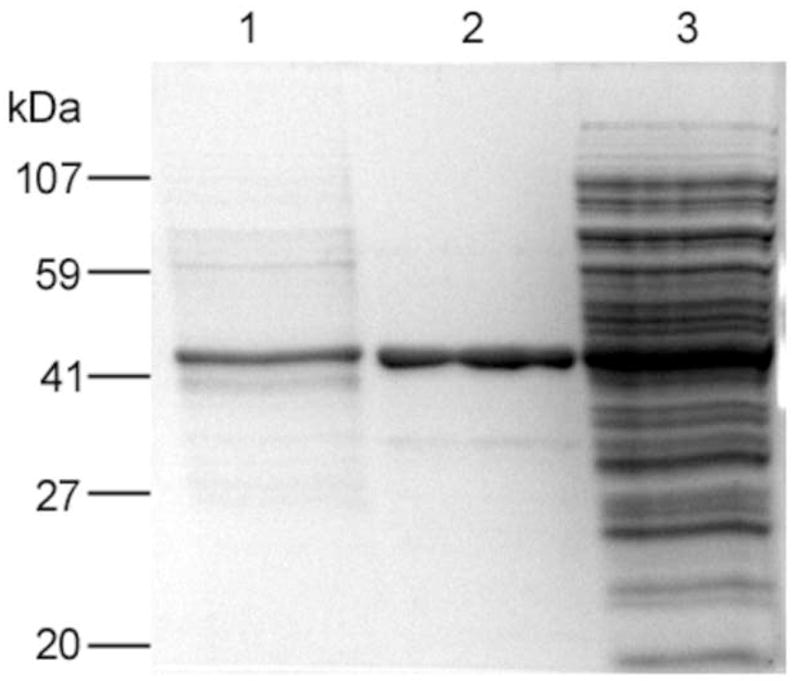
Figure 8.

12% SDS-PAGE of proteins investigated. Bands visible after Coomassie dye staining are in lanes: (1) 2 μg of DTT eluted protein from fraction 11 of the bacterial extract from Fig. 7, (2) 5 μg of Ni2+-NTA purified GFP-C/EBP, and (3) 10 μg of bacterial crude extract.
