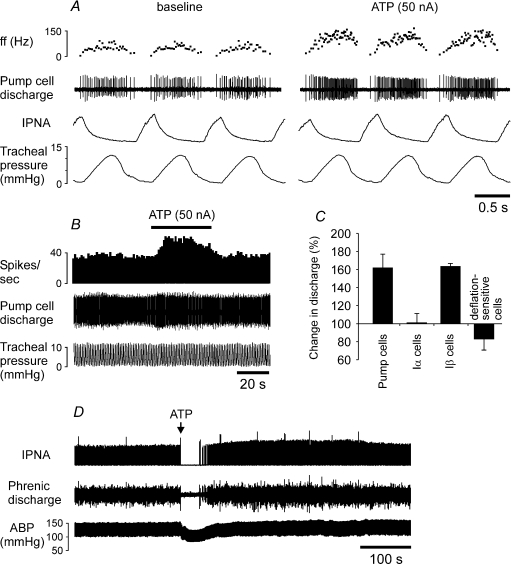
Figure 7. ATP induces an increase in discharge of the NTS pump cells and evokes central apnoea when injected into the NTS.
A, raw data illustrating the response of the NTS pump neurone to microionophoretic application of ATP (20 mm). B, time-condensed record of the firing rate of the same neurone. Black horizontal bar indicates timing of ATP application. C, summary data of peak change in discharge of the NTS rhythmic neurones induced by microionophoretic application of ATP (20 mm, 50 nA). Numbers of neurones in each group are given in the main text (see Results). D, raw data illustrating the effect of ATP (20 mm, 50 nl) on the respiratory activity and arterial blood pressure when microinjected unilaterally into the NTS site where SARs terminate. ABP, arterial blood pressure. ff, instantaneous firing frequency. IPNA, integrated phrenic nerve activity (arbitrary units).

