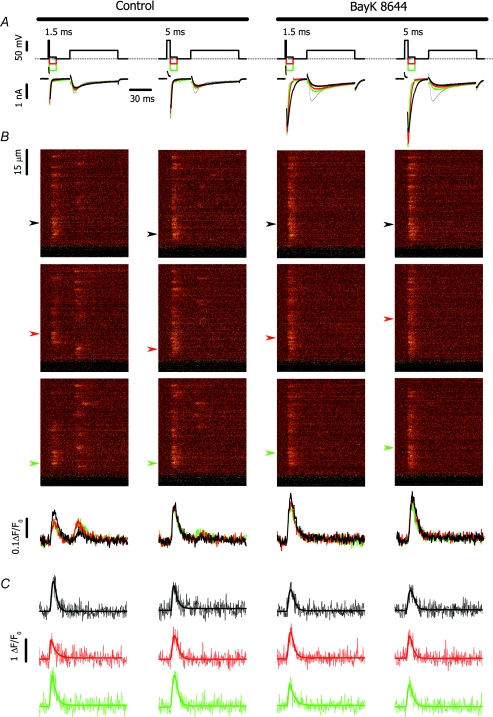
Figure 1. Typical calcium currents and corresponding OG-5N signals evoked by the prepulse protocol in the absence (left) and presence of BayK 8644 (right).
A, voltage stimulus (top) and corresponding calcium currents (bottom). The grey trace denotes the current measured in the absence of prepulse. The black, red and green lines correspond to tail potentials of −120, −80 and −40 mV, respectively. B, line-scan fluorescence images acquired at 0.5 ms per line (top) and the corresponding line average of cell fluorescence at −120, −80 and −40 mV (black, red and green lines, respectively). The spatial (vertical) coordinate in B was parallel to the long axis of the myocyte. The time coordinate is identical to that of panel A. C, fluorescence profiles at −120, −80 and −40 mV (black, red and green lines, respectively) for positions indicated in B by arrows. The arrows correspond to the position of the centre of selected spikes. The time coordinate is identical to that of panel A.

