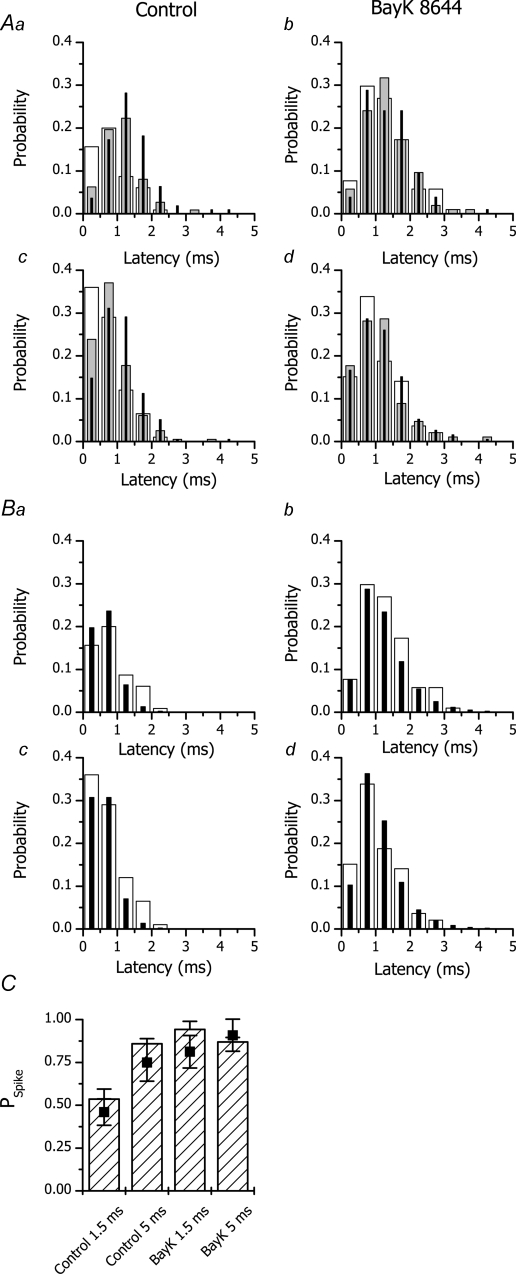
Figure 4. Experimental and theoretical latency distributions and related spike probabilities.
A, experimental probability density distributions of calcium spike latency in the absence (a and c) and presence of BayK 8644 (b and d) at different tail potentials. a and b, 1.5 ms prepulse; c and d, 5 ms prepulse. The responses to tail potentials of −120, −80 and −40 mV are shown as white, grey and black columns, respectively. B, comparison of experimental probability density distribution of calcium spike latency at −120 mV tail potential in the absence (a and c) and presence of BayK 8644 (b and d) with the theoretical distribution. a and b, 1.5 ms prepulse; c and d, 5 ms prepulse. White and black columns denote, respectively, the experimentally measured probability density and the best fit by eqn (8) with parameters shown in Table 1. C, calculated spike probability at −120 mV (filled symbols) compared with the experimentally determined PSpike (hatched columns).

