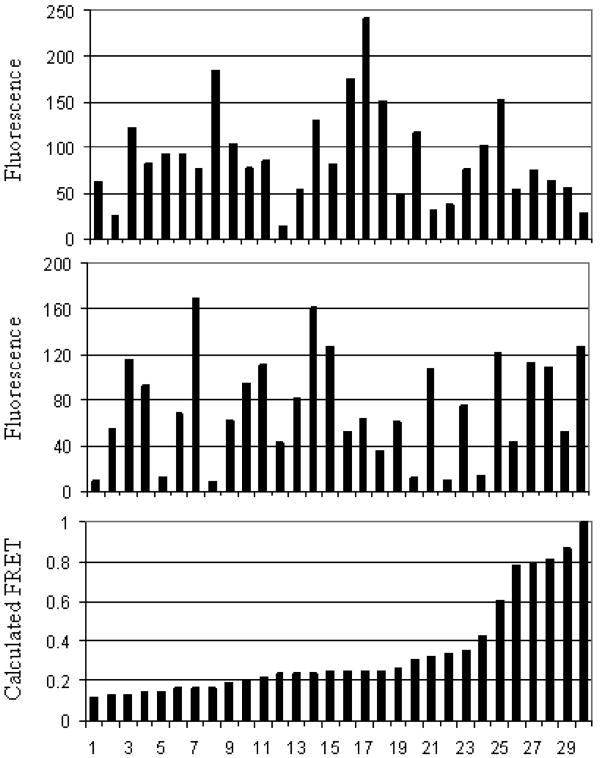
Figure 2.
(Top) mdsRED fluorescence intensity; (Middle) mYFP fluorescence intensity; (Bottom) calculated FRET value for the cell line TCD-β; αβ. Each data point in a column represents the same cell. Background signals were measured by averaging pixel values where no cells were present, and this value was subtracted from the mdsRED and mYFP data (top and middle). Data was taken from a larger set containing 137 cells.

