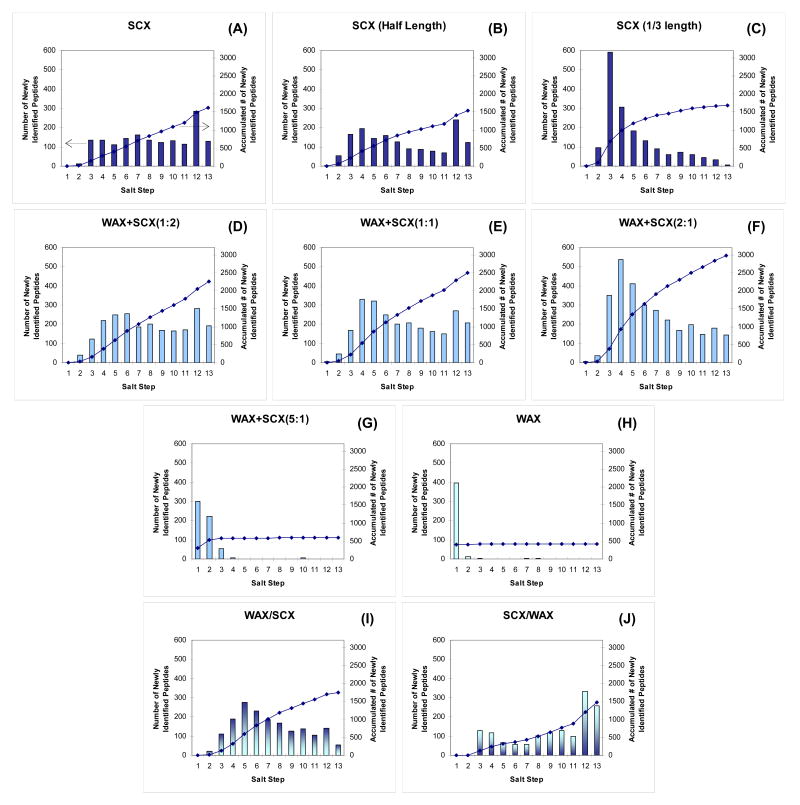
Figure 4. Ion-exchange elution profile comparison of 13-step MudPIT runs with different ion-exchanger combinations.
The graphs were generated from the datasets that provided the best peptide/protein identifications in Figure 3 for each resin combination (where applicable). The runs denoted as SCX(half length) (B) and SCX(1/3 length) (C) used columns of half or 1/3 length of the others so that they contained the same amount of SCX resin and could be compared directly to the WAX+SCX(1:1) or (2:1), respectively. Peptide identifications criteria were modified to 1 peptide per protein with estimated false positive rates < 1% at peptide level. The y-axis indicates the number of peptides newly identified in each step so that peptides already identified in previous salt steps were excluded from the profile. Peptides identified in multiple charge states were counted only once.

