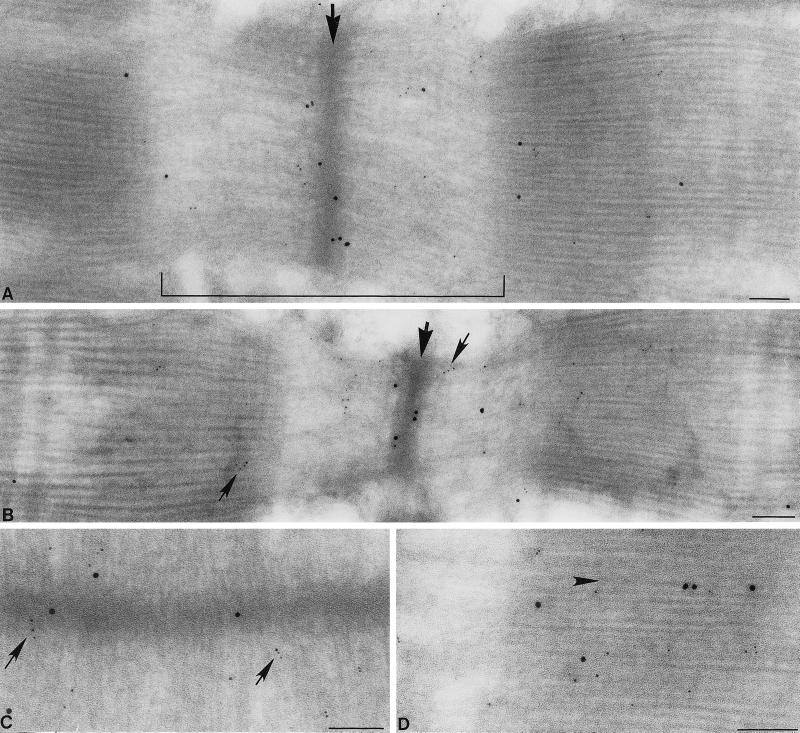
Figure 8.
Immunoelectron microscopic analysis of the distribution of Enigma in skeletal muscle. Immunoelectron micrographs show the presence of Enigma (10-nm gold) and skeletal TM (5-nm gold) in ultrathin sections of adult muscle. (A–C) Enigma (large black dots) is predominantly detected at the boundary of the I band and Z line, whereas skeletal TM (small dots) is detected at the boundary of the I band and Z line and throughout the I band. The arrow in A indicates the Z line, and the bracket spans the I band. The large arrow in B marks the Z line, and small arrows mark skeletal TM detected in the I band and along thin filaments. Arrows in C indicate skeletal TM located at the boundary between the I band and Z line. The arrow in D marks Enigma distribution along a transverse filament. Bar, 0.1 μm.

