Figure 8.
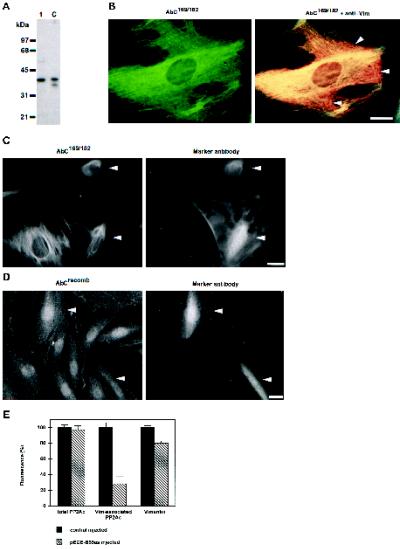
Targeting by B55. (A) Immunoblot analysis of PP2A catalytic subunit from total cell lysates of Hs68 fibroblasts using AbC169/182 were performed similarly to those in Figure 1. Lane 1, ∼20 μg of cell extract; lane C, 5 ng of rabbit skeletal muscle PP2Ac. Positions of molecular mass markers are indicated at the left. The bands revealed are competed by the antigenic peptide. (B) Hs68 fibroblasts were grown on glass coverslips and formalin fixed. Subsequently, they were costained for the catalytic subunit using AbC169/182, revealed by FITC (left panel), and vimentin using mAb V9, revealed by Texas Red, as described for Figure 7B. To visualize colocalization of PP2Ac with vimentin, double exposures of both signal were recorded (right panel). Note that PP2Ac colocalized with most of the vimentin (yellow), but some regions of vimentin were devoid of PP2Ac staining (red, arrowheads). (C and D) Hs68 fibroblasts, grown on glass coverslips, were microinjected with the antisense B55 RNA–expressing construct pECE-B55as. After 12 h, cells were fixed using formalin. In C cells were stained for vimentin-associated PP2Ac using AbC169/182 (left panel) and for the microinjection marker (right panel). In D cells were stained stained for total PP2Ac using AbCrecomb (left panel) and for the microinjection marker (right panel). Arrowheads indicate injected cells. (E) In similar experiments as in C and D, cells were microinjected with the control plasmid pECE or with pECE-B55as. Subsequently they were stained for the totality of cellular PP2Ac using AbCrecomb (Turowski et al., 1995), vimentin-associated PP2Ac using AbC169/182, or vimentin using V9. Subsequently, the fluorescence of each microinjected cell was quantitated using ImgCalc. The histogram shows average fluorescence as determined from at least 30 injected cells for each staining. Values found for control-injected cells were arbitrarily set to 100%. Bars, 5 μm.

