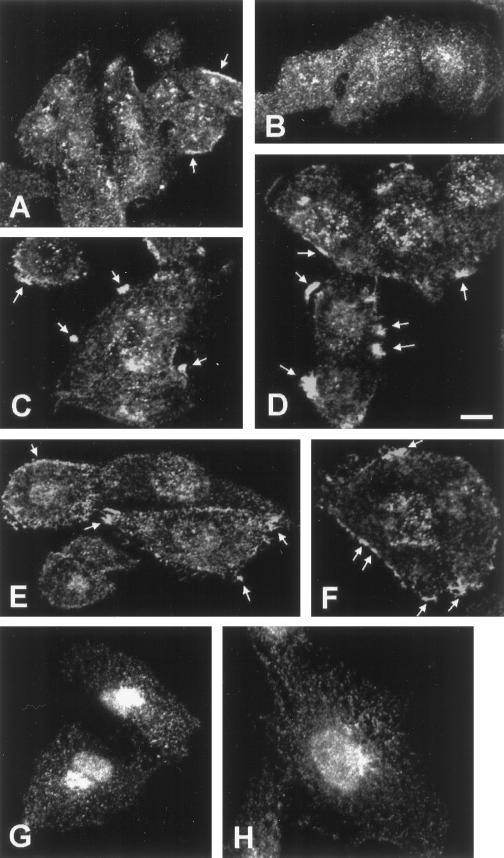
Figure 3.
Distribution of SCAMP1 and SCAMP3 in vanadate-treated CHO cells. CHO cells were vanadate treated for 0 min (A, B, and G), 5 min (C and D), or 20 min (E, F, and H) and immunolabeled with anti-SCAMP3 (3γ, A–F) or anti-SCAMP1 (1Ω, G and H) for visualization by confocal microscopy. The presence of peripheral patches of SCAMP3 immunostaining is indicated by the arrows. Bar, 10 μm.

