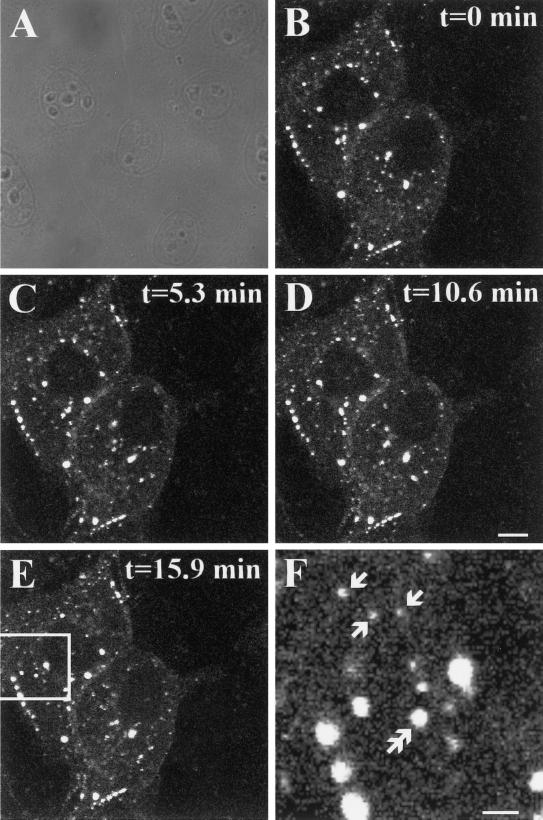
Figure 10.
Two populations of transport intermediates are involved in trafficking Cx43-GFP. Live MDCK cells (A) stably expressing Cx43-GFP were time lapsed imaged over 15.9 min (B–E). A region of E is shown at higher magnification in F to illustrate the two populations of transport intermediates (arrows indicate <0.5-μm small transport intermediates; double arrows indicate 0.5- to 1.5-μm large transport intermediates). t = min. Bars: D, 10 μm; F, 2 μm. (Online version available at www.molbiolcell.org.)

