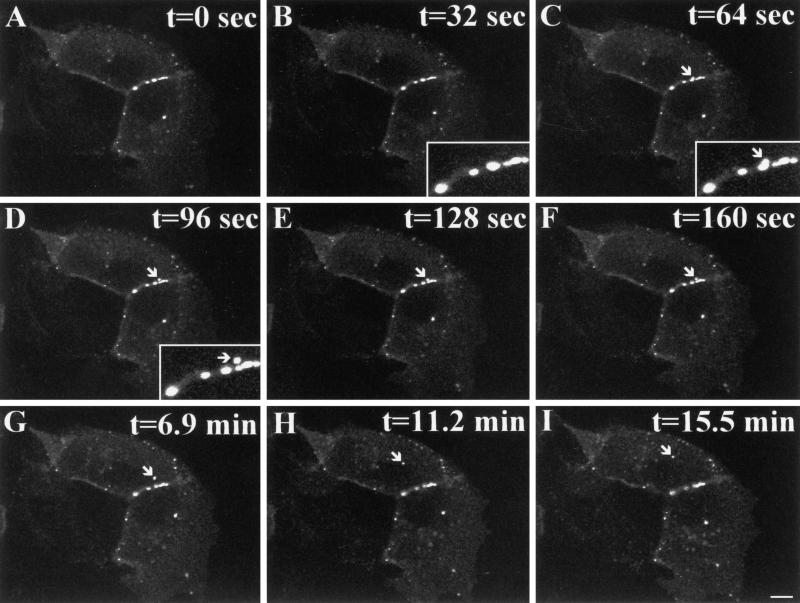
Figure 11.
Internalization of a gap junction in real time. Live MDCK cells expressing Cx43-GFP were time-lapse imaged over 15.5 min. The budding and internalization of a gap junction fragment are demonstrated in consecutive 32-s images (A–F). Insets represent the area of gap junction budding and internalization at higher magnification (B–D). G–I follow the fate of the internalized gap junction (arrow) over a total period of 15.5 min. Bar, 10 μm. (Online version available at www.molbiolcell.org.)

