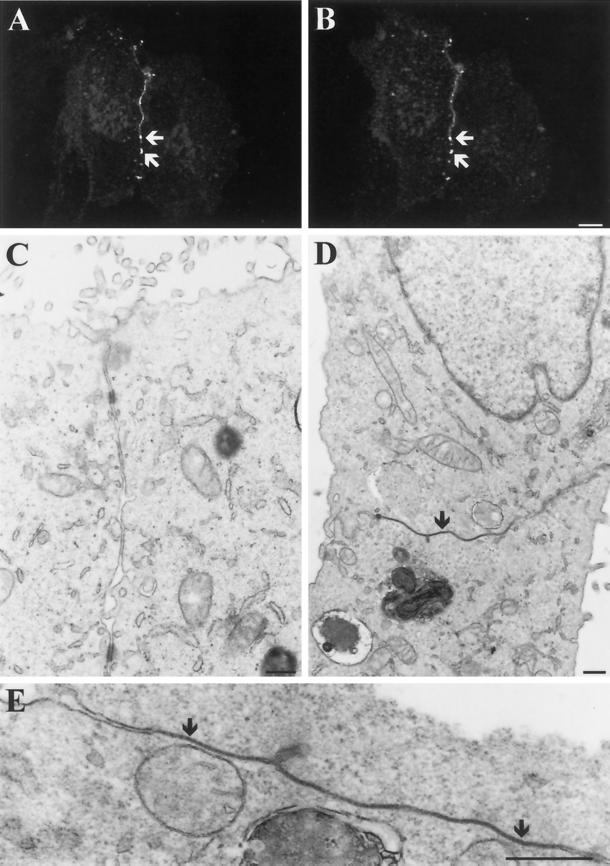
Figure 5.
Micrographs of Triton X-100–resistant gap junctions and gap junction plaques in MDCK cells stably expressing Cx43-GFP. Fluorescent images of MDCK cells expressing Cx43-GFP before (A) and after (B) in situ treatment with 1% Triton X-100 for 20 min are shown. Note the presence of fluorescent gap junctions that have properties of being resistant to Triton X-100 (A and B, arrows). MDCK cells (C) or MDCK cells stably expressing Cx43-GFP (D and E) were fixed and prepared for conventional thin-section electron microscopy. Note the presence of large gap junction plaques, which exhibit the classical pentalaminar profile (D and E, arrows). Bar, 10 μm (A and B); 0.5 μm (C–E).

