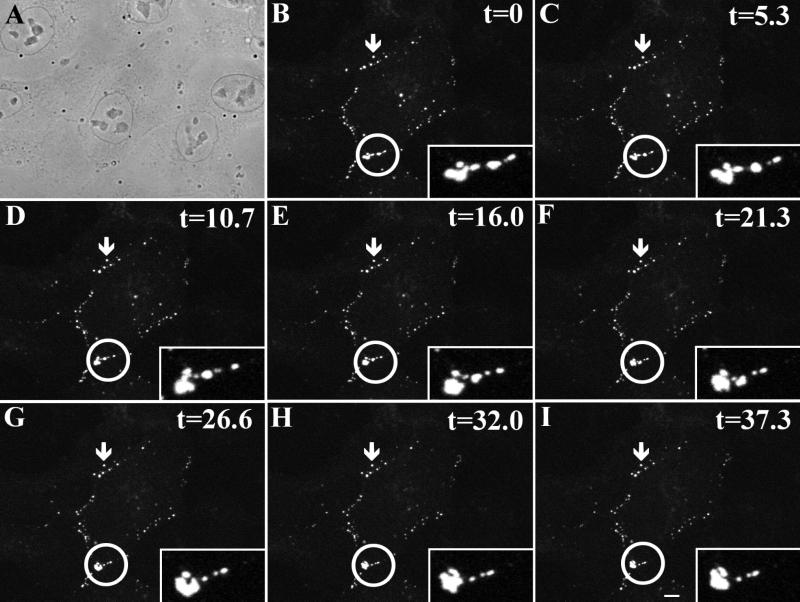
Figure 9.
Time series showing the dynamics of gap junction plaques within the plasma membrane of live MDCK cells. MDCK cells stably expressing Cx43-GFP were imaged on a Zeiss inverted confocal microscope over 37.3 min as described in MATERIALS AND METHODS. The arrows denote a gap junction plaque that remains relatively stationary throughout the time course of the experiment (B–I). Enclosed within the circle are several fluorescent gap junctions that coalesced within the plasma membrane. Insets represent an area at higher magnification where gap junctions undergo clustering. t = min; bar, 10 μm. (Online version available at www.molbiolcell.org.)

