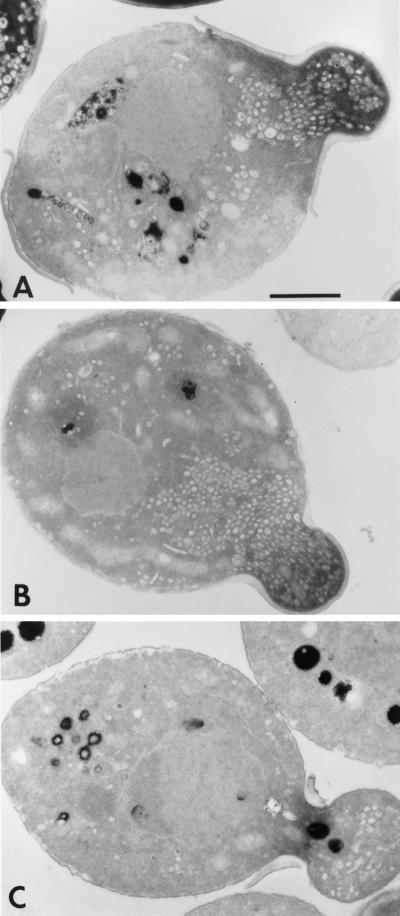
Figure 8.
Electron microscopic analysis of cells co-overexpressing Sec15p with Sec10ΔC or Sec10CT. Yeast were grown for 10 h in galactose to induce the overexpression of Sec10ΔC, Sec10CT, and Sec15p. Cells were then processed for electron microscopy as described in MATERIALS AND METHODS. (A) Cell overexpressing Sec15p alone. (B) Cell co-overexpressing Sec15p and Sec10ΔC. (C) Cell co-overexpressing Sec15p with Sec10CT. Scale bar, 1 μm.

