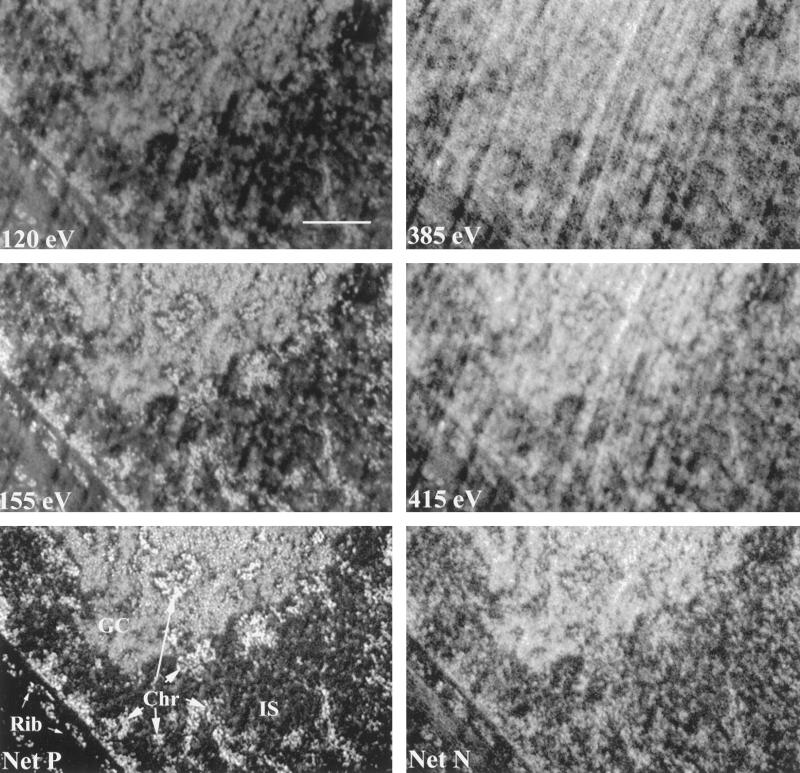
Figure 1.
ESI of cellular structures. The principles of ESI of chromatin, ribonucleoprotein, and protein structures are illustrated. An energy loss series was recorded from an ultrathin section of an Indian muntjac fibroblast cell. The top series shows a reference 120-eV energy loss image, a phosphorus-enhanced 155-eV energy loss image, and a phosphorus distribution map (Net P) calculated from these two images. The bottom panels show analagous pre-edge and element-enriched images used to generate a nitrogen distribution map (Net N). The images in the top two panels show structure as bright on a dark background. Bar, 2.3 μm.

