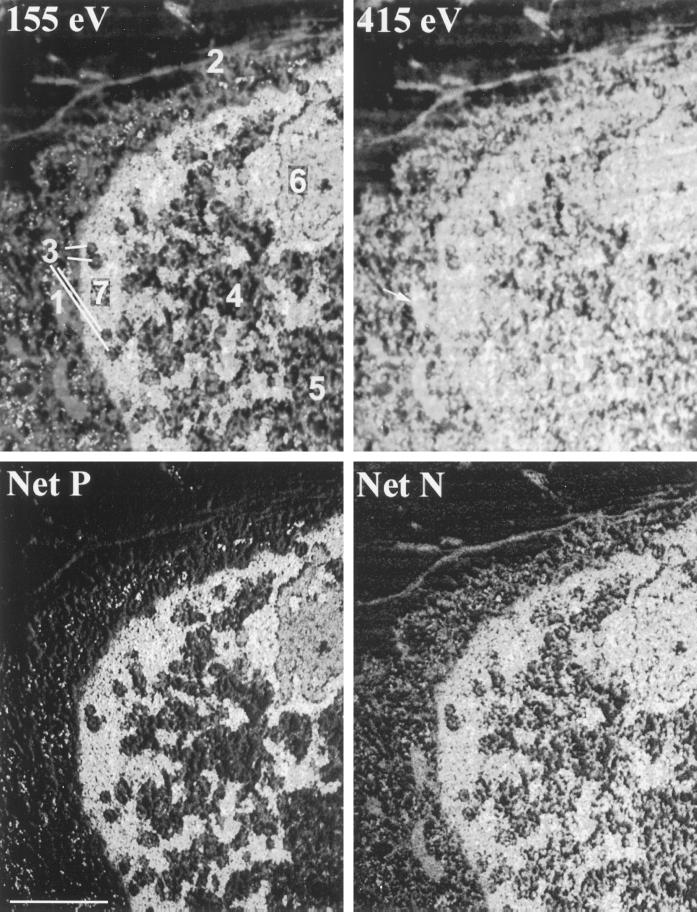
Figure 2.
Relative phosphorus and nitrogen contents of compositionally defined and compositionally undefined cellular structures. An energy loss series was collected on a mouse 10T½ cell. The 155-eV phosphorus-enhanced, 415-eV nitrogen-enhanced, net nitrogen (Net N), and net phosphorus (Net P) images are shown. The regions numbered 1–7 were analyzed quantitatively for both phosphorus and nitrogen content. The arrow in the 415-eV image indicates the position of a mitochondrion (region 1). The results of these measurements are presented in Table 1. Bar, 1 μm.

