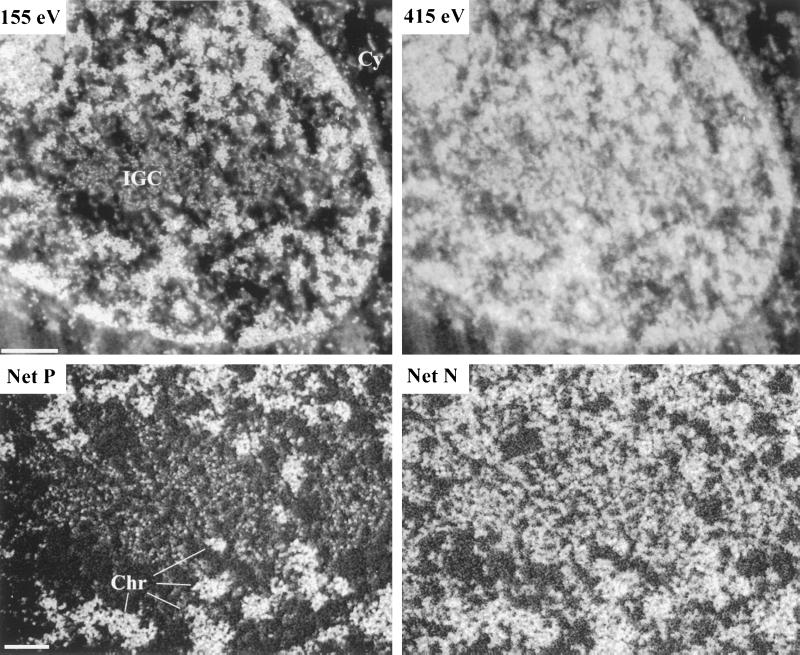
Figure 4.
Phosphorus and Nitrogen distributions within IGCs. An energy loss series was collected for a region of an Indian muntjac fibroblast cell nucleus containing a prominent IGC. The top two panels show the 155 eV phosphorus-enhanced and the 415 eV nitrogen-enhanced images. The bottom two panels show, at higher magnification, the net phosphorus (Net P) and net nitrogen (Net N) maps within and around the IGC. Cy, cytoplasm; Chr, examples of chromatin. Bar, 250 and 200 nm in the top and bottom panels, respectively.

