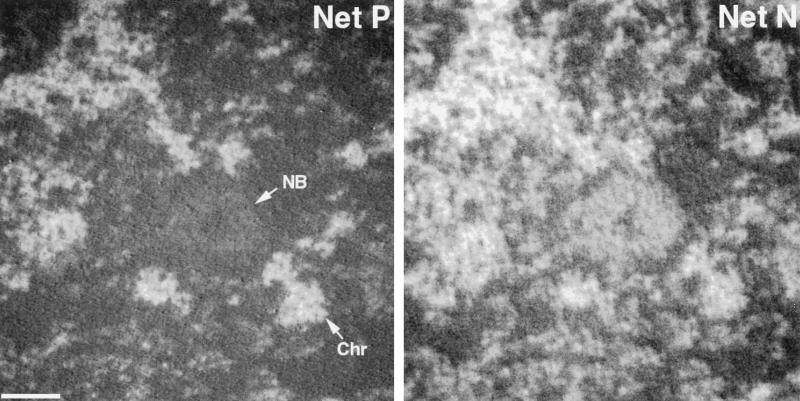
Figure 5.
Phosphorus and nitrogen mapping of a nuclear body. A nuclear body was identified by fluorescence imaging of an SKN cell nucleus stained with anti-CBP. An energy loss series was then collected on a subregion of the cell nucleus containing the nuclear body. The net phosphorus and net nitrogen maps are shown. NB, nuclear body; Chr, chromatin. Bar, 120 nm.

