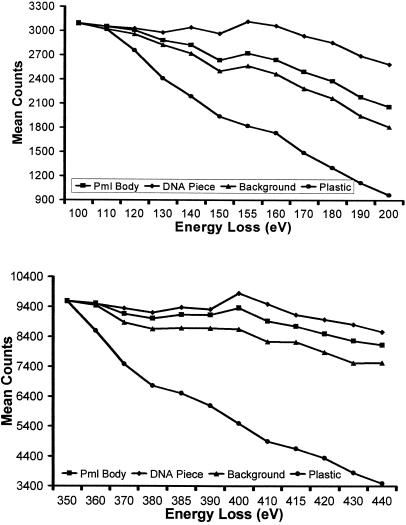
Figure 6.
Detection of protein phosphorylation. The integrated density of a nuclear body (Pml Body), DNA (Chr in Figure 5), and a background region of the nucleoplasm were calculated across an energy loss series, spanning both the phosphorus ionization edge (upper graph) and the nitrogen ionization edge (lower graph), using a constant exposure time. Under these conditions, the phosphorus and nitrogen signals generated by the plastic decay at the expected rates. In contrast, all three nuclear structures give detectable phosphorus signals between 130- and 160-eV energy losses, characteristic of the presence of a phosphorus L2,3 ionization edge.

