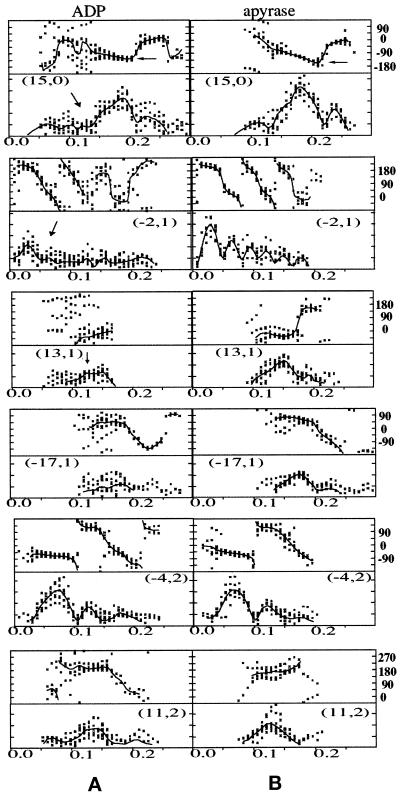
Figure 2.
Amplitudes and phases along the main layer lines of computed Fourier transforms. Phases (in degrees) are plotted in the upper half of each panel; amplitudes (all on the same scale) are shown in the bottom plots. The phases have been corrected for rotations about the microtubule axis and for shifts in the position of the phase origin along the axis to give the best overall agreement among different images. The data points are from individual images of 15-protofilament brain microtubules decorated with KΔ430 in ADP (A) or in the absence of nucleotides (effect of apyrase; B). The plotted lines show the averaged values. The layer-line indexing (n,l) refers to the Bessel order n, or number of equivalent helices in 15-protofilament microtubules, and the layer-line number l, based on a nominal 8-nm axial repeat. Some differences between nucleotide states are indicated by arrows: the phase distribution on the (15,0) layer line does not fall as steeply for ADP as for the tightly bound state; amplitudes on several layer lines are lower for the ADP state.

