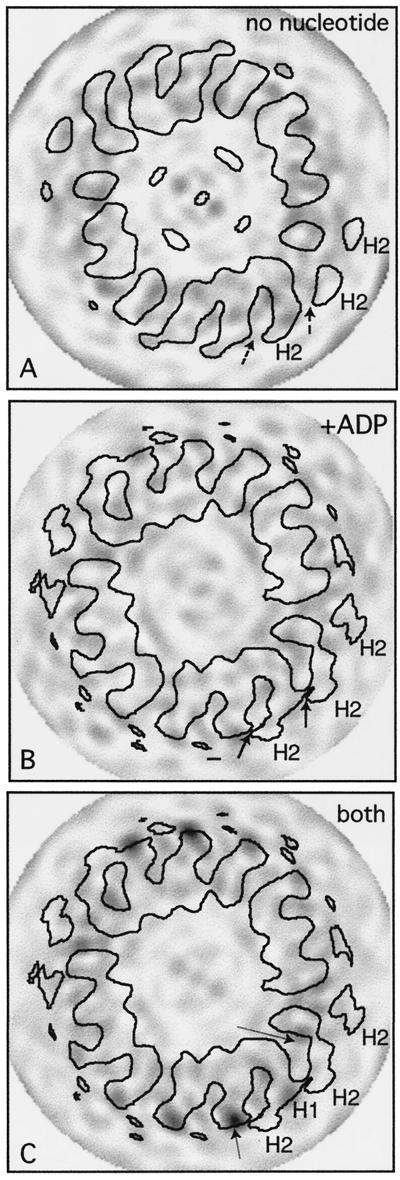
Figure 4.
Contoured cross sections with variance levels. (A and B) Cross sections through the average maps in Figure 3 superimposed on variance values calculated from the individual maps. Arrows point to the projecting feature, sectioned at various levels, present in kinesin·ADP (B) but missing in the empty state (A). (C) Variancesobtained when nucleotide-free and ADP data sets are mixed. All variances are shown on the same scale, with darker density for higher values; there are peaks (arrows) on the exposed surface of the bound heads (H1), close to the point of attachment of the tethered heads (H2) and also close to where the tops of the bound heads contact tubulin, reflecting the changes described in the text.

