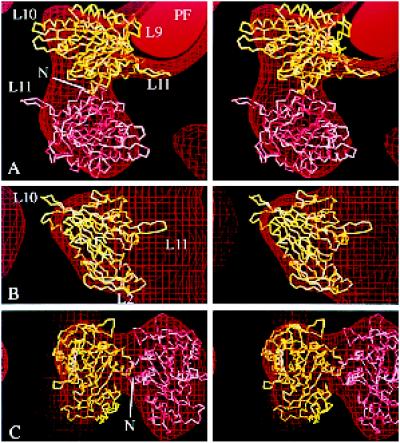
Figure 8.
Fitting the atomic structure of ncd into our ncd·ADP map. (a–c) Stereo views of the α-carbon backbone of monomeric ncd (Sablin et al., 1996) oriented inside a map showing tubulin protofilaments (PF) decorated with dimeric ncd with bound ADP (Hirose et al., 1998). As in Figures 6 and 7, the map is represented at a single contour level as a surface net (red lines). One copy of the monomeric ncd crystal structure (yellow) is positioned in the attached head density; another (pink) lies in the tethered head density. The labeled loops (L11, L9, etc.) are equivalent to those in the kinesin structure (see Figure 5). The side view (b) at 90° to a is shown with the tethered head removed. The front view in c is at 90° to both a and b. There is an approximate twofold axis between the heads, running almost vertically in c. N, N terminus.

