Figure 6.
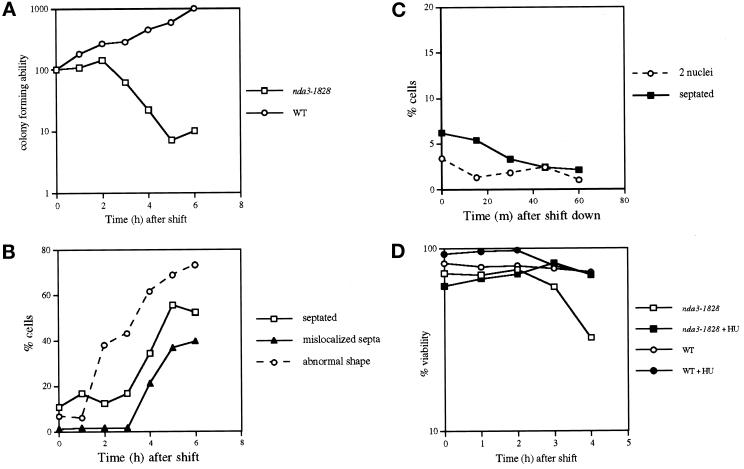
ts nda3 mutants proceed through the cell cycle and lose viability at the restrictive temperature. (A and B) ts nda3 mutant (DH12; Table 1) and wild-type (HM123) cells were grown at 26°C and shifted to 35.5°C, and aliquots were collected hourly. After appropriate dilution (10−4), cells were plated on rich YES plates to examine colony-forming ability per culture (A, the value at time 0 was taken as 100%; ○, wild type; □, ts nda3). Vertical axis (%) is shown logarithmically. Septation index and percentage of cells with abnormal cell morphology in the ts nda3 mutant (B, □ and ○, respectively) were observed with Calcofluor staining, and the percentage of cells that showed septa displaced from the center of the cell is also shown (▴). In wild-type cells, these abnormal cells were never observed (<0.1%). (C) For the reversibility experiments, ts nda3 cells incubated at 35.5°C for 2 h (note that viability is still high at this time point; see A) were shifted down to 26°C, and septation index (using Calcofluor, ▪) and the percentage of cells with two nuclei (using DAPI, ○) were scored at 15-min intervals for 1 h. (D) The same strains as in A (wild type shown as circles and ts nda3 as squares) were grown in the presence (closed symbols) or absence (open symbols) of 10 mM hydroxyurea in rich YPD for 3 h at 27°C and shifted to 35.5°C. Cell number was measured at each time point, and viability was examined by plating cells (10−4 dilution) on rich YES plates. After plates were incubated at 27°C, the number of colonies was counted, and viability at each time point was calculated by dividing the number of viable cells by the cell number. Vertical axis (%) is shown logarithmically.

