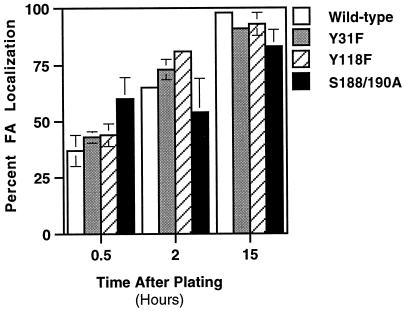
Figure 7.
Localization rate of paxillin molecules containing mutations of the fibronectin-inducible phosphorylation sites Y31/118 and S188/190 is comparable to cells expressing wild-type avian paxillin. CHO.K1 fibroblasts expressing avian paxillin were maintained in suspension for 1 h before plating onto duplicate glass coverslips coated with 10 μg/ml fibronectin. At 0.5, 2, and 15 h, the coverslips were processed for immunofluorescence double-labeling using a chicken-specific polyclonal antiserum (Pax1) and either PY20 (Transduction Labs, Lexington, KY) to label FAs, or rhodamine-phalloidin (Molecular Probes, Eugene, OR) to decorate actin stress fibers. At each time point 150–200 transfected cells were counted with the number of avian paxillin transfectants displaying FA localization of the avian paxillin determined and divided by the total number of transfected cells. This is represented in bar graph form as the “Percentage localization to FA.” All experiments were performed in duplicate with at least three independent experiments executed and tabulated to determine mean and SD from the mean. Statistical analyses were performed with Student’s t test; *, p < 0.05; **, p < 0.01.

