
Figure 3.
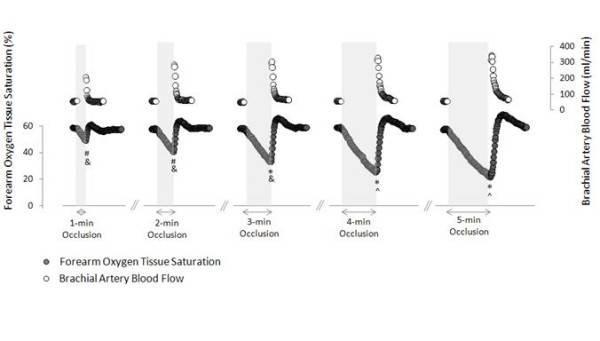
Time course of forearm oxygen tissue saturation (NIRS) in conjunction with brachial artery blood flow (ultrasound). Values are means. *Volume of ischemia (StO2AUC) significantly different from all other trials; #Volume of ischemia (StO2AUC) significantly different from 3-min, 4-min, and 5-min; &Peak ischemia (StO2peak) significantly different from all other trials; ^ Peak ischemia (StO2peak) significantly different from 1-min, 2-min, and 3-min. All p < 0.0001. Ultrasound data were not collected during the occlusion periods.