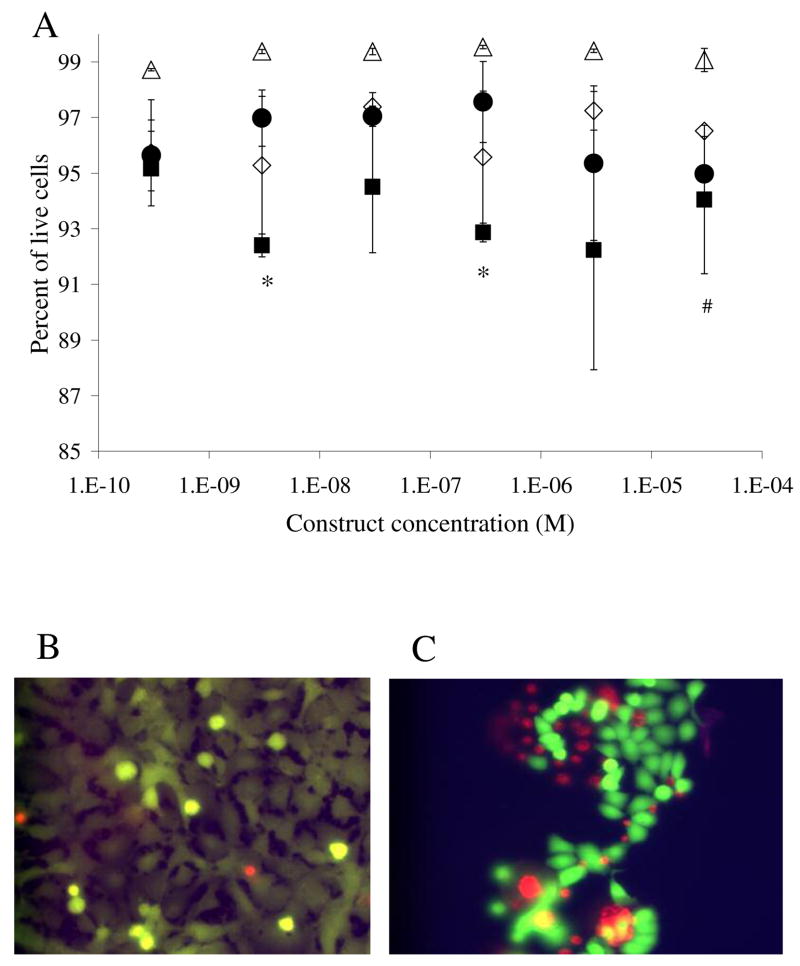
Figure 5.
Live/dead analysis. (A) Open symbols represent toxicity results of the dodecapeptide, triangles of the normal astrocytes, and diamonds of the glioblastoma cells. Solid symbols represent results of the toxicity of the trivalent construct, circles of the normal astrocyte cells and squares of the glioma cells. Statistical difference in toxicity levels are marked, (*) for the trivalent (p<0.01) and (#) for dodecapeptide (p<0.01). Note the compressed scale of the y-axis. Error bars denote standard error of the mean (n=4). (B) Representative picture of the live/dead assay on normal astrocyte cells. (C) Picture illustrating live/dead assay on glioma cells. Dead cells appear at the edge of the cell clusters leading to large error bars when the imaging field is selected randomly.

