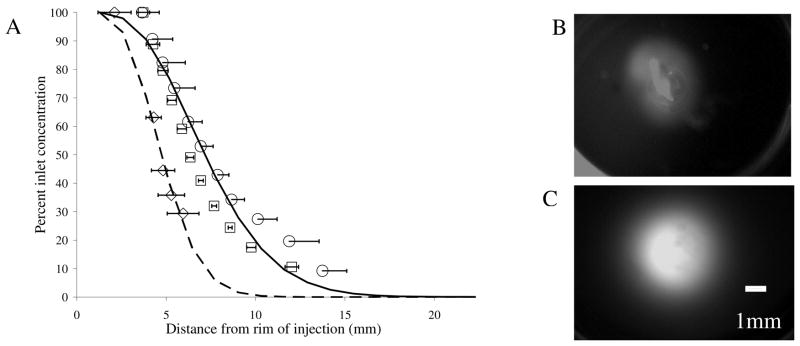
Figure 6.
(A) Perfusion profiles of quantum dots (diamond, n=2), dodecapeptide construct (square, n=2), and trivalent construct (circle, n=3). Continuous lines depict model results fit for the diffusion and retardation coefficients, dashed (QD) and solid (trivalent). Perfusion patterns of quantum dots (B) and trivalent construct (C) after two hours of infusion. Scale = 1mm.

