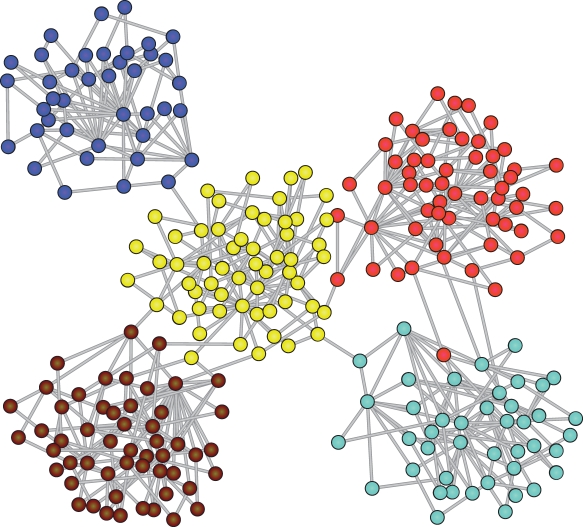
Figure 4. Graph representation of the modular scale-free network.
The nodes are colored according to the dynamic clustering tree (resulting from a simulation with f = 0.01) after assigning a threshold for 5 modules (the number of topological modules). The dynamic clustering agrees with the topological modules almost completely.

