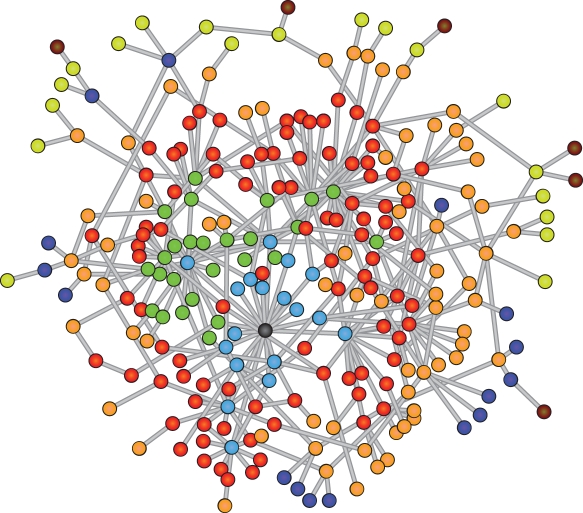
Figure 6. Network representation of the BA graph.
The nodes are colored according to the dynamic cluster tree (resulting from a simulation with f = 10−5) after assigning a threshold for 7 modules (the maximal distance to the hub). Most of the dynamically detected clusters are arranged in a ring-like fashion around the central hub highlighted in black.

