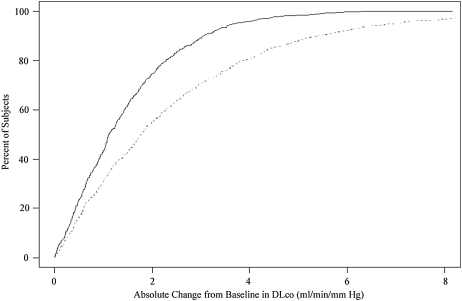
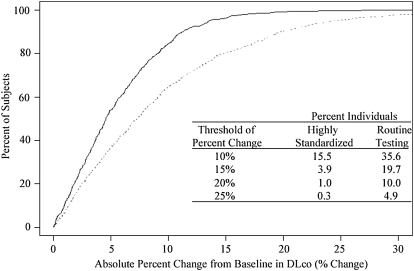
Figure 3.
Cumulative frequency curve of absolute change (top) and absolute percent change (bottom) from baseline in DlCO. The highly standardized method is shown by the solid line, and the routine method by the broken line. The table (bottom panel) delineates the percentage of individuals exceeding different thresholds of percentage of change from baseline DlCO.


