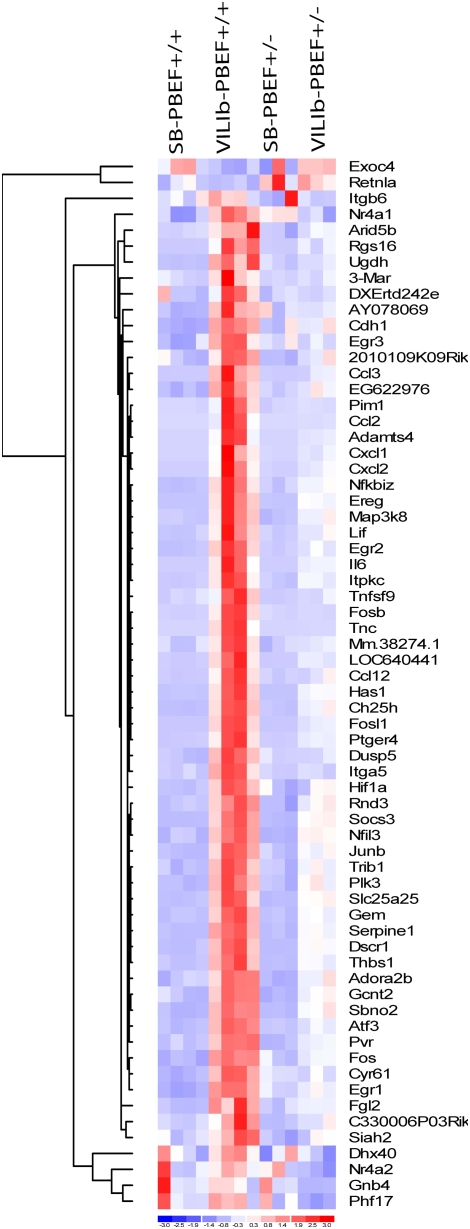
Figure 8.
Gene expression pattern of differentially expressed genes in VILIb-challenged wild-type (WT) mice and VILIb-challenged heterozygous pre–B-cell colony enhancing factor (PBEF+/−) mice Differentially expressed genes between VILIb-WT and VILIb-PBEF+/− challenged mice were generated by Significance Analysis of Microarrays (Table E2). The expression levels of the differentially expressed genes between VILIb-WT and VILIb-challenged PBEF+/− mice are displayed by dChip hierarchical clustering (DNA and enrichment analysis) (http://biosun1.harvard.edu/complab/dchip/clustering.htm). Blue, white, and red represent expression levels below, at, and above mean levels, respectively.

