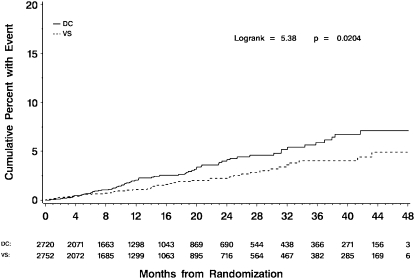
Figure 1.
Kaplan-Meier curves for time to first episode of bacterial pneumonia. The solid line represents the viral suppression (VS) group; the dashed line represents the drug conservation (DC) group. The overall hazard ratio of events (DC/VS) was 1.55 (95% confidence interval, 1.07–2.25; P = 0.02).

