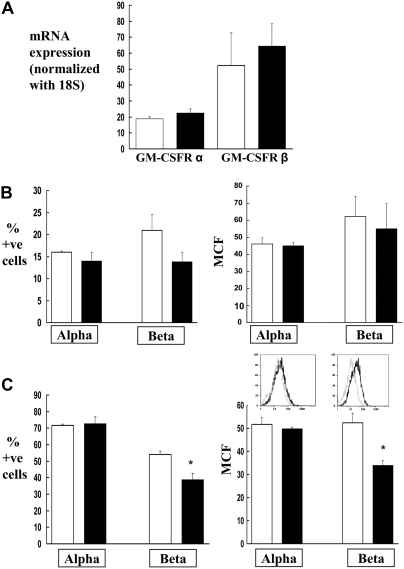
Figure 2.
Expression of GM-CSFRα and GM-CSFRβ gene and protein on alveolar macrophages. (A) The gene expression of GM-CSFRα and GM-CSFRβ by real-time PCR. Each value represents the mean ± SEM of three rats in each group. (B) Flow cytometric analysis of membrane expression of GM-CSFRα and GM-CSFRβ on alveolar macrophages from wild-type and HIV-1–transgenic rats. (C) Flow cytometric analysis of intracellular expression of GM-CSFRα and GM-CSFRβ on alveolar macrophages from wild-type and HIV-1–transgenic rats. In both panels, data are represented as percentage of positive cells and MCF. Insets in C show representative histograms of MCF for GM-CSFRα and β. Histograms for receptors from wild-type and transgenic rats are represented by black and gray lines, respectively. Negative control cells (cells stained with isotype-matched control antibody) were routinely less than 1% for percentage of positive cells (data not shown) and were subtracted from the positive control. Each value in B and C represents the mean ± SEM of six to eight rats in each group. *P < 0.05 compared to wild-type rats. Both HIV-1–transgenic and wild-type rats used in these experiments were 8 to 9 months old.

