Figure 1.
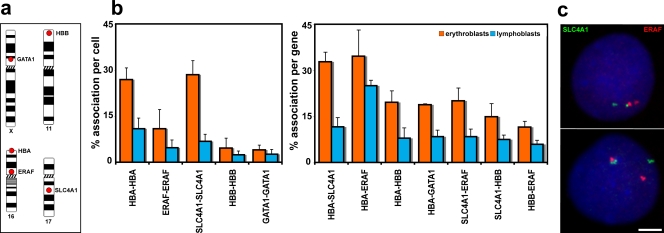
Associations between genes up-regulated in erythroblasts. (a) Chromosomal locations of the five genes analyzed. (b) Degree of associations between erythroid genes detected by DNA-FISH to intermediate erythroblasts and lymphoblasts. Allelic associations are depicted on the left, and inter-genic associations are depicted on the right. Allelic associations involving the HBA, SLC4A1, and ERAF genes are the most common in erythroblasts and demonstrate highly significant increases over the levels scored in lymphoblasts. The HBB and GATA1 genes are more frequently involved in inter-genic than allelic associations in erythroblasts. The scores for inter-genic associations in the right-hand chart represent the percent association per gene, not per cell, because many cells had both SLC4A1 genes involved in associations. GATA1 was scored only in female cells. Numbers of nuclei analyzed and individual p-values are given in Table I. Values represent the mean ± SD (error bars) from 2–22 independent experiments. These patterns of association mirrored those obtained by 3D hybridizations for α- and β-globin (Brown et al., 2006) and for SLC4A1 and ERAF (not depicted), although slightly higher values of association were obtained by 3D FISH. (c) Typical trans-associations between SLC4A1 (green) and ERAF (red) detected by DNA-FISH. Bar, 4 μm.

