Figure 2.
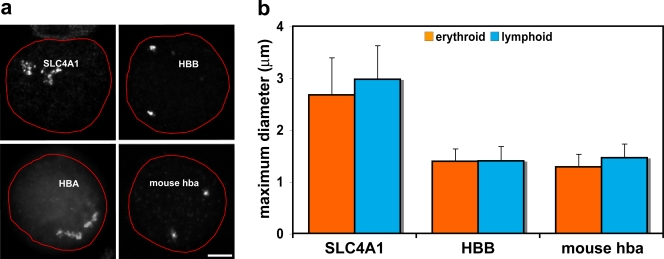
Chromosomal environments differ between erythroid-specific genes. (a) Representative intermediate erythroblast nuclei after DNA-FISH of four 2-Mb BAC contigs. The nuclear periphery is outlined in red. The contig centered on the SLC4A1 gene on HSA17 shows marked decondensation of the chromatin region. The contig centered on the HBB gene on HSA11 does not exhibit the same levels of decondensation. The contig covering the mouse α-globin genes on MMU11 again does not display the levels of decondensation seen around SLC4A1. The contig covering the terminal 2 Mb of 16p13.3, surrounding the human α-globin genes, has been published previously (Brown et al., 2006) and is included here to demonstrate the marked difference in chromatin decondensation around the human and mouse α-globin genes. Note that the telomeric chromatin around HBA is more linearly extended than that around interstitial SLC4A1. (b) Maximum diameter measurements of BAC contig FISH signals in erythroblast and lymphoblast nuclei for SLC4A1, HBB, and mouse α-globin. These measurements minimize differences in signal size because they cannot take account of folding in the discontinuous SLC4A1 signal, yet there are significant differences between values for SLC4A1 and HBB and also for SLC4A1 and mouse α-globin. Values represent the mean ± SD (error bars) of measurements taken from one to two hybridizations for each contig probe set and cell type. Bar, 3 μm.

