Figure 5.
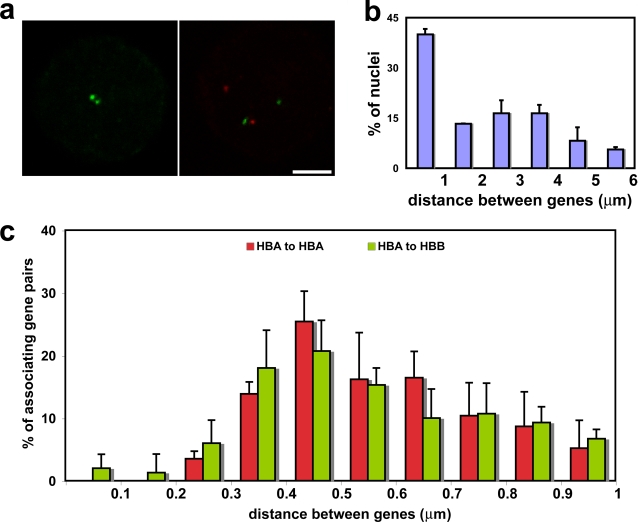
Associating genes are not commonly coincident. Measurements between globin RNA-FISH signals in intermediate erythroblasts. (a) Typical α–α (green-green) and α–β (green-red) associations. (b) Measurements between α-globin signals showing a bimodal distribution; a similar distribution was seen for α–β distances (not depicted). Values represent means ± SD (error bars) from two independent experiments. (c) Distances between associating α–α signals (HBA–HBA) and α–β signals (HBA–HBB) separated by <1 μm. Both have a mean separation of ∼0.5 μm. Values represent means ± SD from four independent experiments for both α–α associations and α–β associations. Bar, 4 μm.

