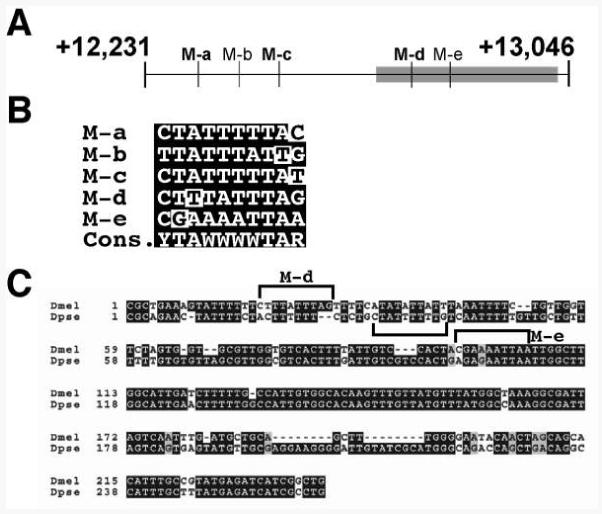
Figure 4. Identification of putative MEF2 sites in the Tg enhancer.

A: Schematic diagram of the enhancer, showing the locations of five putative MEF2 binding sites (labeled M-a through M-e). The region of the enhancer most conserved with D. pseudoobscura is indicated as a gray box. B: Comparison of the sequences of the five sites with the MEF2 consensus. Mismatches to consensus are indicated with white highlights. C: Conservation of Tg enhancer sequences between D. melanogaster and D. pseudoobscura. Note that, whereas the M-d sequence is not conserved, a nearby sequence in D. pseudoobscura (bracketed) contains a putative MEF2 site.
