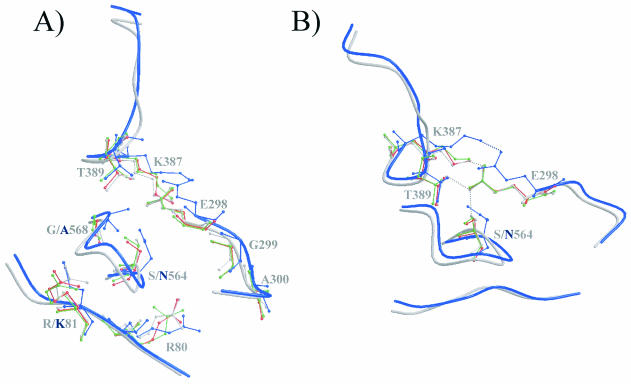
FIG. 6.
Comparison of the models for wt CPV, wt FPV, CPV-N93D, and CPV-N93R. (A) Backbone trace of CPV and FPV at VP2 regions containing residues 80 and 81 (reference monomer), 298 to 300 (threefold related), and 387 to 392 and 564 to 568 (fivefold related). The surface view is similar to that used in Fig. 1. Colors are as defined in Fig. 2. Residues that differ between CPV and FPV or that might be engaged in interactions between adjacent VP2 monomers are shown in ball-and-stick format. (B) Some of the residues in panel A have been removed, and the figure was rotated to show the possible interaction(s) between residues E298, K387, and T389 and between residues E298 and S564. Regions of H-bonding interactions are indicated by the dotted lines in the same colors as used for the respective structures.

