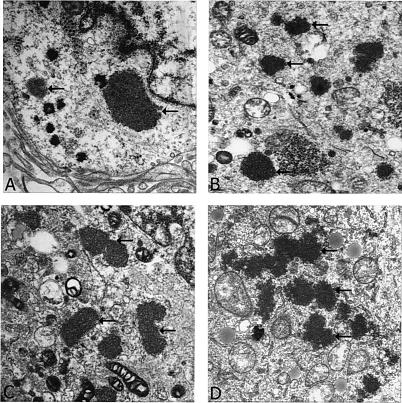
FIG. 6.
Analysis of viroplasms and VLS by transmission electron microscopy. (A) Virus-infected cells. (B) Cells cotransfected with NSP5-GFP and NSP2 expression plasmids. (C) Capability of GFP-NSP5 alone to form VLS in tranfected cells. (D) GFP-NΔ65-transfected cells, in which we previously observed (by confocal imaging) intense particulate VLS. Arrows indicate electron-dense viroplasms and VLS.

