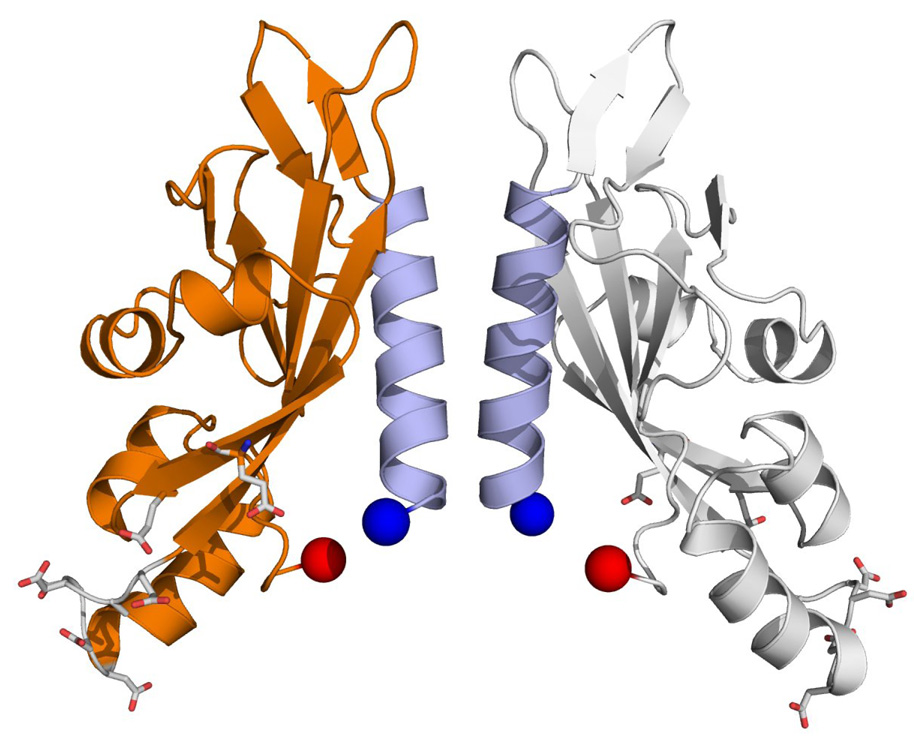
Figure 3.
Best scoring model of the PhoQ periplasmic domain. Model 734, after rigid-body minimization with XPLOR-NIH, is shown. The N-terminal ends are 16 Å apart. The C-terminal ends are 22 Å apart. N-terminal helices are colored light blue. Negatively charged residues implicated in forming interactions with the membrane are shown in stick representation.

