Figure 4.
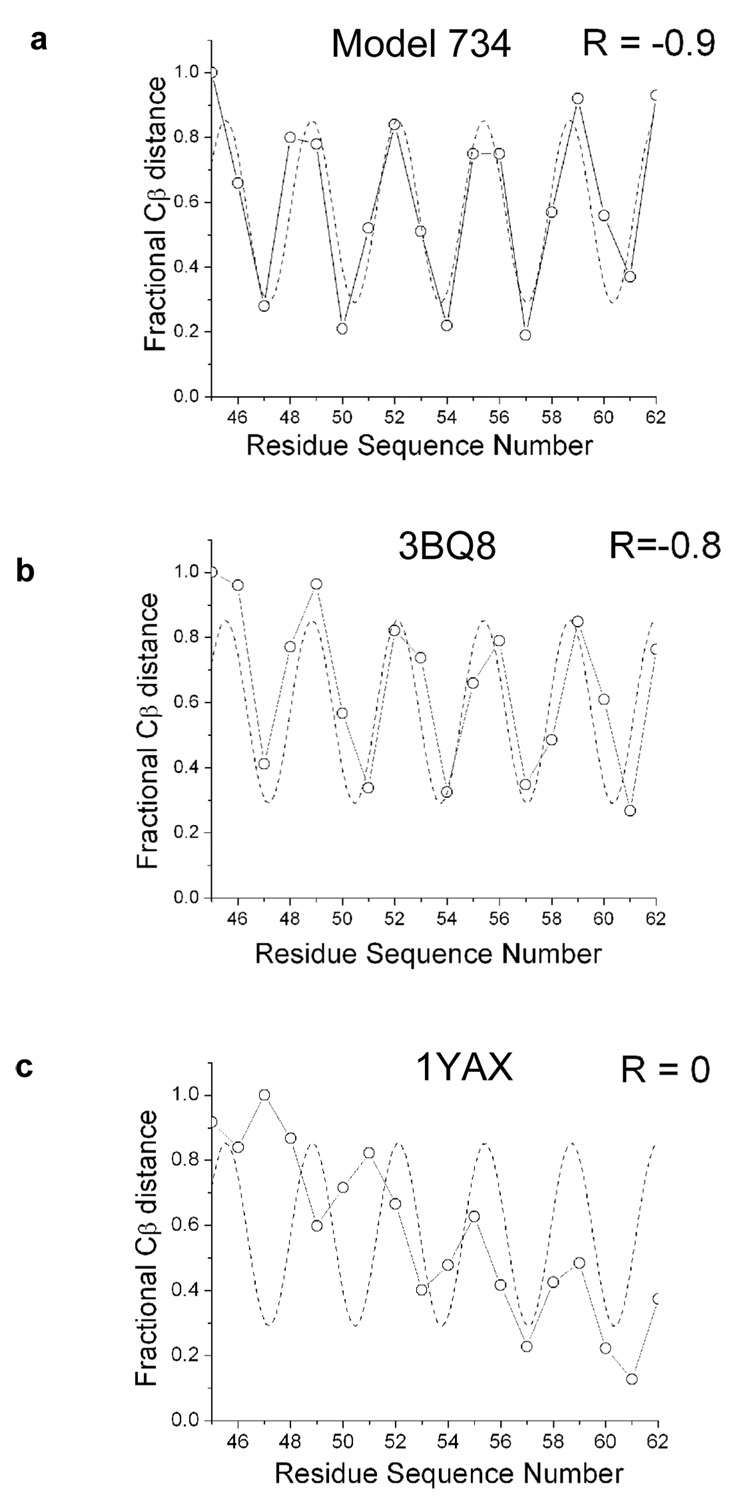
Periodicity plots. Periodicity versus Cβ distance is shown for (a) Model 734 (b) 3BQ8 and (c) 1YAX. The best fit curve (---) was obtained by fitting the percentage of cross-linking between residues to equation [1] and then shifting the phase by π to transform the data from being anti-correlated to correlated. Fractional values were obtained by dividing all the Cβ distances for a set by the largest distance in the set. The distance between Cα atoms was used for glycine 54. Correlation coefficients (R) between distances and the theoretical cross-linking curves are shown.

